Sidebar

Main Menu Mobile

  • Home
  • Blog(s)
    • Marco's Blog
  • Technical Tips
    • MySQL
      • Store Procedure
      • Performance and tuning
      • Architecture and design
      • NDB Cluster
      • NDB Connectors
      • Perl Scripts
      • MySQL not on feed
    • Applications ...
    • Windows System
    • DRBD
    • How To ...
  • Never Forget
    • Environment
  • Search
TusaCentral
  • Home
  • Blog(s)
    • Marco's Blog
  • Technical Tips
    • MySQL
      • Store Procedure
      • Performance and tuning
      • Architecture and design
      • NDB Cluster
      • NDB Connectors
      • Perl Scripts
      • MySQL not on feed
    • Applications ...
    • Windows System
    • DRBD
    • How To ...
  • Never Forget
    • Environment
  • Search

MySQL Blogs

My MySQL tips valid-rss-rogers


PGO or not PGO this is the dilemma. Step 3

Details
Marco Tusa
MySQL
09 October 2026

Step 3: Why my sysbench-trained build loses and how to do it right.

Given the topic complexity and the length of this article I have split it in 3 three different blog-post:

  1. What is PGO
  2. How PGO it works
  3. Why my sysbench-trained build loses and how to do it right.

Three compounding reasons:

  1. Uncovered code gets pessimized.
    Sysbench-tpcc touches a narrow slice of mysqld.
    Every function with zero counts is treated as cold: GCC optimizes it for size, skips inlining, and shoves it into cold sections.
    But at runtime I still execute plenty of code my training never touched, such as purge, flushing, stats recalculation, error paths, different optimizer plans, connection churn.
    All of that is now running de-optimized code, and I pay icache penalties every time hot code calls into "cold" regions.
    This is why GCC added -fprofile-partial-training, without it, a narrow profile actively hurts everything outside it.
  2. High-concurrency instrumented runs produce corrupted or skewed profiles.
    GCC's profile counters are non-atomic by default.
    With 128–1024 threads hammering the same counters I get lost updates and internally inconsistent counts (I actually had "profile count data file corrupted/inconsistent" warnings at the -fprofile-use compile).
    I need to use -fprofile-update=atomic, which almost nobody sets and was at the beginning not aware of.
    In short my profile was garbage and a garbage profile is worse than no profile, consistent with my PGO build being slower than plain -O3 at 128 threads.
  3. Instrumentation distorts what "hot" means under contention.
    The instrumented binary is 2–10x slower, which shifts where threads pile up. Spin loops in mutexes and rw-locks record enormous counts, so the compiler lavishes optimization on waiting code instead of useful work. While at high thread counts my real bottleneck is lock contention and memory latency things branch layout can't fix.

Do I have a way to merge the different profiles like MTR + sysbench?
The answer is yes. For GCC it's simple to do so, because the runtime automatically merges profile data across multiple training runs against the same instrumented binary. I don't need a separate merge step like Clang does.

What it does is that each time an instrumented binary exits, it writes its counters into files. If those files already exist (from a previous run), GCC's runtime adds the new counts to the existing ones rather than overwriting them.
So if I run MTR first, then run sysbench against the same instrumented build with the same FPROFILE_DIR, the second run's counts accumulate on top of the first. The final profile reflects both workloads combined. 

Combining MTR with a moderate-thread sysbench run for PGO training is helpful because the two workloads cover different, complementary dimensions of mysqld's behavior: 

  • MTR sweeps broad functional breadth parser, optimizer, DDL, replication, error paths. However it runs almost entirely single-connection, so it never exercises the branches that only exist under real concurrency, like the contended slow-path of a latch, MVCC visibility checks against in-flight writers, lock-wait queuing, or redo-log group-commit batching;
  • A moderate-concurrency sysbench run (something like 4–64 threads, enough to create actual simultaneous access without descending into the timing-distortion and counter-corruption problems), fills exactly that gap by giving those concurrency-only branches nonzero execution counts, which keeps the compiler from treating them as cold, since cold code paths get optimized for size instead of speed.

So the merged profile ends up with both the wide code coverage MTR provides and the concurrent-path coverage MTR structurally can't, at the cost of only a modest, second-order improvement over MTR alone since PGO's overall gains are already small and this specific slice of the binary is a narrow fraction of total execution.


However even where it does help, I am stacking a small effect on top of a small effect. I have already found PGO vs non-PGO gives me under 5%.
The incremental gain from better-covering a narrow slice of concurrency-only code within that is a second-order refinement.
It is plausibly in the sub-1% range, quite  smaller than the run-to-run noise I had seen just from benchmark variance.

Or at least that is what I now think, let me validate it.

Commands to build the code:

cmake ../mysql-9.7.2 \
-DCMAKE_INSTALL_PREFIX=/opt/mysql_templates/mysql-9.7.2-PGO-instrument \
-DCMAKE_BUILD_TYPE=Release \
-DENABLED_LOCAL_INFILE=1 \
-DWITH_FEDERATED_STORAGE_ENGINE=1 \
-DWITH_ARCHIVE_STORAGE_ENGINE=1 \
-DWITH_PACKAGE_FLAGS=OFF \
-DCOMPILATION_COMMENT_SERVER="Marco compile 9.7.2-PGO instrument" \
-DCOMPILATION_COMMENT="Marco compile 9.7.2 PGO instrument" \
-DCMAKE_C_COMPILER=clang-20 \
-DCMAKE_CXX_COMPILER=clang++-20 \
-DCMAKE_C_FLAGS="-fuse-ld=lld" \
-DCMAKE_CXX_FLAGS="-fuse-ld=lld" \
-DFPROFILE_GENERATE=ON \
-DWITH_LTO=OFF \
-DFPROFILE_DIR=/opt/mysql_source/profile

Run the mtr:

perl mysql-test-run.pl --force --max-test-fail=0 --parallel=8 --suite=main,innodb,innodb_undo,binlog,rpl,perfschema,sys_vars


Then run the sysbench-tpcc test with 64 threads

sysbench /opt/tools/sysbench-tpcc/tpcc.lua --mysql-host=127.0.0.1 --mysql-port=3307  --mysql-user=app_test --mysql-password=test --mysql-db=tpcc --db-driver=mysql --tables=10 --scale=100 --rand-type=uniform --report-interval=1  --histogram --report_csv=yes  --stats_format=csv --db-ps-mode=disable --trx_level=RR --enable_purge=yes --time=600 --threads=64 --mysql-ssl=PREFERRED --mysql-ignore-errors=none  --reconnect=0  run

And got the profile as

[root@sm-blade03 profile]# llvm-profdata-20 show -detailed-summary /opt/mysql_source/profile/mysql.profdata
/opt/mysql_source/profile/mysql.profdata
Instrumentation level: IR entry_first = 0 instrument_loop_entries = 0
Total functions: 52403
Maximum function count: 289910820864
Maximum internal block count: 16881288068
Total number of blocks: 619050
Total count: 2473216025729
Detailed summary:
2 blocks (0.00%) with count >= 289910820864 account for 1% of the total counts.
2 blocks (0.00%) with count >= 289910820864 account for 10% of the total counts.
2 blocks (0.00%) with count >= 289910820864 account for 20% of the total counts.
11 blocks (0.00%) with count >= 16777125216 account for 30% of the total counts.
32 blocks (0.01%) with count >= 7806039615 account for 40% of the total counts.
77 blocks (0.01%) with count >= 3839409465 account for 50% of the total counts.
160 blocks (0.03%) with count >= 2273821592 account for 60% of the total counts.
312 blocks (0.05%) with count >= 1111890303 account for 70% of the total counts.
719 blocks (0.12%) with count >= 365989756 account for 80% of the total counts.
2165 blocks (0.35%) with count >= 85858392 account for 90% of the total counts.
4893 blocks (0.79%) with count >= 24359463 account for 95% of the total counts.
16760 blocks (2.71%) with count >= 2841200 account for 99% of the total counts.
45006 blocks (7.27%) with count >= 148881 account for 99.9% of the total counts.
96619 blocks (15.61%) with count >= 8640 account for 99.99% of the total counts.
157023 blocks (25.37%) with count >= 960 account for 99.999% of the total counts.
220001 blocks (35.54%) with count >= 91 account for 99.9999% of the total counts 

Checking on how counts concentrate: just 2 blocks account for 20% of all executed instructions across the entire training run (almost certainly a tight InnoDB buffer-pool/redo-log/lock_manager loop  counts in the hundreds of billions), while 90% of total execution volume is concentrated in only 2,165 blocks (0.35% of all covered blocks). 

That's the "hot core" PGO is designed to find and optimize aggressively. Meanwhile the long tail,  the other 96%+ of blocks, still has nonzero counts (this is a sparse profile, so anything appearing here was actually executed at least once).

Meaning a huge amount of MTR's functional-path breadth got captured even though it's numerically dwarfed by sysbench's tight hot loops.

This is the ideal shape for a merged profile: a small, extremely hot core (from sustained sysbench load) sitting on top of broad, low-frequency-but-nonzero coverage (from MTR's functional sweep). 

If MTR had contributed nothing, I would have a much flatter, narrower distribution with far fewer total functions covered.
If sysbench had swamped everything with no MTR contribution, I would have a similar shape but with a much smaller "Total functions" number, since sysbench-tpcc only touches a fraction of mysqld's total surface.

Command to build the final optimized binaries:

llvm-profdata-20 merge -sparse /opt/mysql_source/profile/*.profraw -o /opt/mysql_source/profile/mysql.profdata

cmake ../mysql-9.7.2 \
 -DCMAKE_INSTALL_PREFIX=/opt/mysql_templates/mysql-9.7.2-PGO-optimized-MTR-sysbench \
  -DCMAKE_BUILD_TYPE=Release \
  -DENABLED_LOCAL_INFILE=1 \
  -DWITH_FEDERATED_STORAGE_ENGINE=1 \
  -DWITH_ARCHIVE_STORAGE_ENGINE=1 \
  -DWITH_PACKAGE_FLAGS=OFF \
  -DCOMPILATION_COMMENT_SERVER="Marco compile 9.7.2-PGO optimized MTR+sysbench" \
  -DCOMPILATION_COMMENT="Marco compile 9.7.2 PGO optimized MTR+sysbench" \
  -DCMAKE_C_COMPILER=clang-20 \
  -DCMAKE_CXX_COMPILER=clang++-20 \
  -DFPROFILE_USE=ON \
  -DFPROFILE_DIR=/opt/mysql_source/profile/mysql.profdata \
  -DWITH_SSL=system -DWITH_ZLIB=system -DWITH_LZ4=system -DWITH_ICU=system \
  -DWITH_NUMA=ON -DWITH_LTO=ON -DWITH_LD=lld -DWITH_SYSTEMD=1 \
  -DWITH_UNIT_TESTS=OFF -DWITH_ROUTER=OFF -DMYSQL_MAINTAINER_MODE=OFF

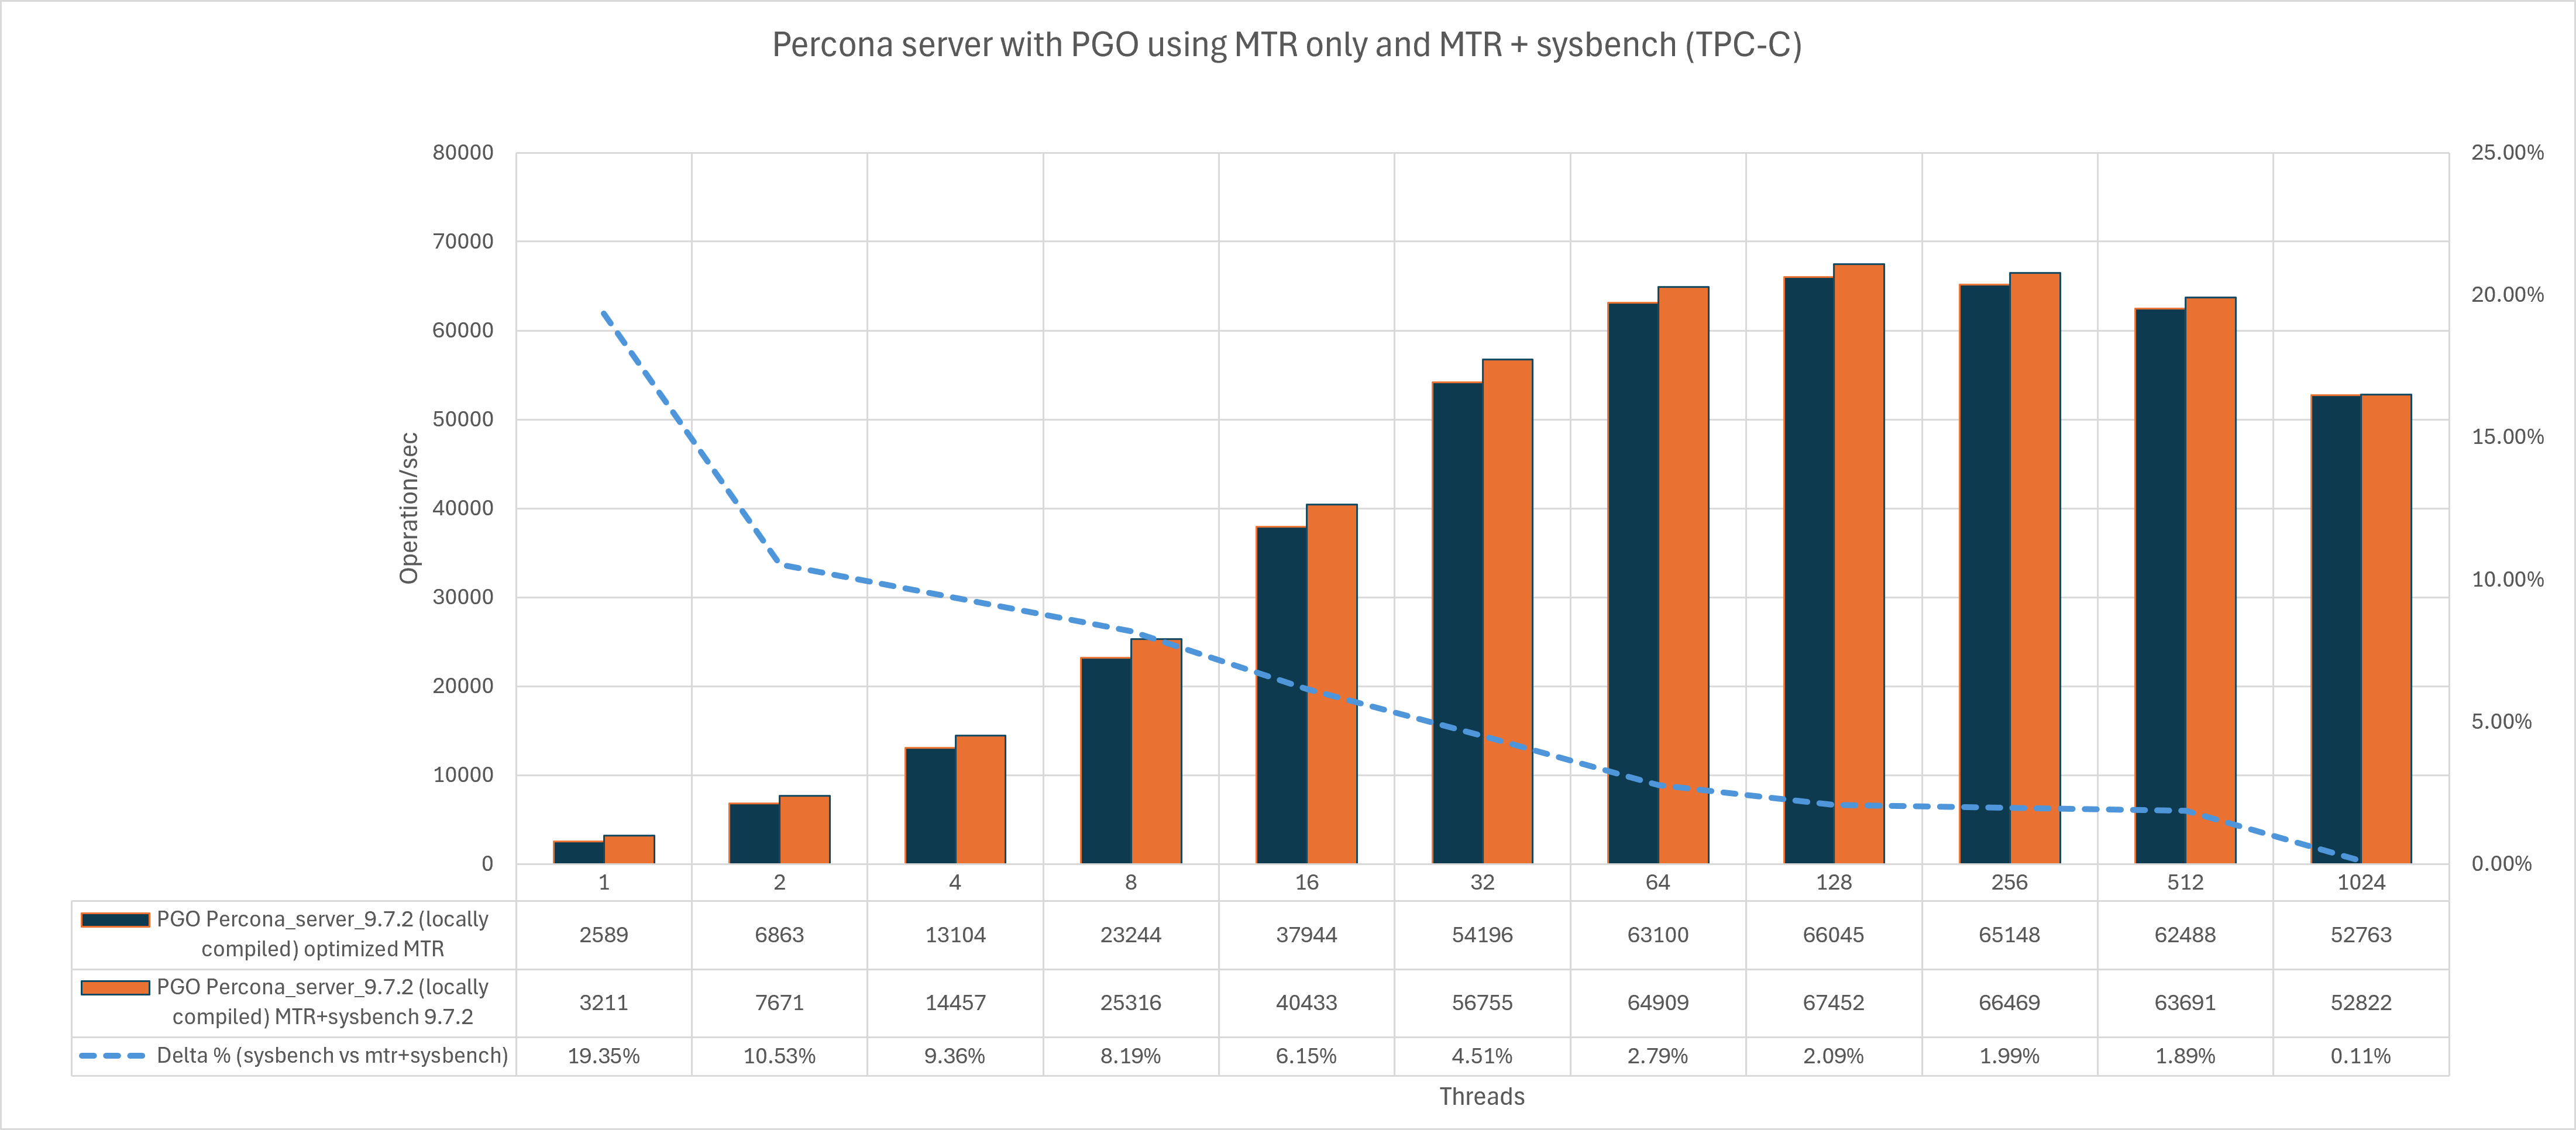
Re-running the test I got this:


As expected the benefit I got was minimal, something was there but that disappeared while the concurrency increased.


Conclusions

  • Non-PGO vs PGO comparison: we had a 12% increase with low concurrency. But when simulating a more realistic load with higher contention the win becomes smaller and smaller, under 2%.
  • Training-workload choice mattered a lot: a sysbench-tpcc-trained PGO build ended up slower than a non-PGO.
  • After switching to a merged MTR + moderate-concurrency-sysbench training profile and re-running, the gain was still minimal, and it shrank further as concurrency increased.


Why the sysbench-only build lost

Sysbench-tpcc only exercises a narrow slice of mysqld, so everything outside that slice (purge, flushing, stats, error paths, alternate optimizer plans) gets pessimized as "cold" code.

At 128–1024 threads, GCC's non-atomic profile counters get corrupted under contention unless I explicitly set -fprofile-update=atomic,a garbage profile is worse than no profile at all.

Instrumentation overhead (2–10x slowdown) distorts what looks "hot" under load mutex/rwlock spin loops dominate the counts, so the compiler optimizes waiting code instead of real work, while the actual bottleneck (lock contention, memory latency) is something branch layout can't fix anyway.

Bottom line: PGO for MySQL/Percona Server binaries does work in the sense that the mechanism is sound whole-binary function reordering for something the size of mysqld is a legitimate, often the single biggest, win in PGO generally. 

But empirically here the payoff was consistently small (sub-5%, trending toward sub-1% for the concurrency-specific refinement), fragile to training-workload choice, fragile to build-flag correctness (atomic counters, -fprofile-partial-training), and it erodes further as thread count rises,  which is exactly what happens in production and what we care about most.

So my practical answer: it's not a clear "yes, always compile with PGO." It's more a “maybe, and only if you get every detail right". Correct broad-coverage training data (MTR, ideally merged with moderate-concurrency sysbench), atomic profile counters, and realistic expectations that the win is marginal and shrinks under heavy concurrency. 

Get any of those wrong and you can end up worse than a plain build.
Given the size of the benefit versus the number of ways to mess up the training methodology, PGO reads more like a niche optimization for a well-controlled build pipeline than a default you'd flip on broadly.

I would be more than happy to prove wrong and I am eager to get other people's feedback, so please test, test, test and let me know. 


Happy MySQL to everyone

Go to:

What is PGO

How PGO it works

No comments on “PGO or not PGO this is the dilemma. Step 3”

PGO or not PGO this is the dilemma. Step 2

Details
Marco Tusa
MySQL
09 October 2026

Step 2: How it works

Given the topic complexity and the length of this article I have split it in 3 three different blog-post:

  1. What is PGO
  2. How PGO it works
  3. Why my sysbench-trained build loses and how to do it right.

How PGO works: PGO is a two-pass build. First pass compiles with instrumentation (-fprofile-generate): every basic block and branch gets a counter.
You run a training workload, counters are dumped to profraw files.
Second pass recompiles using those counts to drive inlining decisions, branch layout (hot path falls through, cold path jumps away), hot/cold function splitting, code ordering for icache/iTLB locality, loop unrolling, and indirect-call promotion.
Crucially, PGO is not "make the trained workload fast" it's "tell the compiler which code is hot and which is cold, and let it reshape the whole binary accordingly."


But how does it work?

Phase 1: what actually gets recorded. The instrumented binary has counters injected at compile time one per edge in the control-flow graph, not just per function.
So for every branch, every loop back-edge, every call site, there's a counter that increments each time execution takes that path.
This is finer-grained than "function X was called N times" it's "when we reached this branch, we went left 950,000 times and right 50 times."
That per-edge granularity is what lets the second phase make surgical decisions rather than just "function X is hot, function Y is cold."

Phase 2: what the compiler does with those counts. Several distinct transformations, all driven by the same counter data:

Inlining.
Normally the compiler inlines based on static heuristics:

  • function size call-site count
  • estimated cost/benefit. 

With profile data it can override those heuristics: a call site executed millions of times gets inlined even if it looks "too expensive" by static cost rules, because the runtime benefit clearly outweighs the code-size cost. 

A call site that's technically inlinable but sits in dead-cold code gets left as a real call inlining it would only bloat the binary for no benefit.

Branch layout.
Every "if" in our code compiles down to a branch instruction with two possible outcomes: 

  • continue straight to the next instruction
  • jump somewhere else. 

Continuing straight is basically free; the CPU is already fetching instructions in order, so there's no extra cost.
Jumping is not free: the CPU has to guess in advance which way a branch will go so it can keep fetching ahead of time, and if it guesses wrong, it has to throw away the work it already queued up and start over from the right place.

That is the "pipeline bubble," a small stall. So the "straight through" path is cheap and the "jump elsewhere" path carries a penalty when the guess is wrong. 

The compiler arranges the hot path as the fall-through and pushes the cold path out of line; literally relocated to a separate location in the binary, often into a .text.unlikely section.
So an if (unlikely_error_condition) { ...rare handling... } block doesn't sit inline interrupting the hot path anymore; it is moved somewhere else entirely, and the hot path becomes a straight run of instructions with no diversion.

To be clear, reordering our if/else in the source code usually doesn't change how the compiler lays out the machine code. Optimizing compilers decide branch layout themselves based on either profile data (PGO) or static heuristics, not on which branch we happened to write first in the source. So swapping the order of our if blocks by hand generally has little to no effect on the compiled result.

Hot/cold function splitting.
This is the same idea applied within a single function.
A function might have a hot core loop and a rarely-hit error-handling tail.
The compiler physically splits the function into two pieces: 

  • the hot part stays in .text.hot
  • the cold part moves to .text.unlikely. 

The function still works identically (a jump connects them when needed), but now the hot part is smaller and denser, so more of it fits in an instruction-cache line, and cold code that's almost never touched isn't wasting icache space sitting next to it.

Whole-binary function reordering.
This is where "reshape the whole binary" becomes literal.
At link time (especially with LTO, which MySQL's PGO build enables), functions get physically reordered in the final executable so that functions which call each other frequently, or execute in sequence during a hot workload, are placed near each other in memory.
This maximizes instruction-cache and iTLB locality; the CPU's fetch unit is pulling in a tight cluster of hot functions instead of jumping all over a 100+MB binary.
For something the size of mysqld, this is often the single biggest win, because normal builds place functions in whatever order the source files happen to be compiled, which has no relationship to runtime call patterns.

Indirect-call promotion.
If profile data shows a virtual call or function-pointer call resolves to the same target the overwhelming majority of the time (common in C++ with vtables, e.g. a storage-engine interface with basically only InnoDB registered), the compiler inserts a guarded direct call: "if target == this specific address, call it directly and skip the indirect jump; otherwise fall back to the indirect call."
Direct calls are cheaper and more predictable for the branch predictor than an indirect jump through a table.

Register allocation and code density trade-offs.
Hot code gets compiled favoring speed, more aggressive unrolling, more registers dedicated to hot-path values.
Cold code, especially with -fprofile-partial-training and cold-path treatment, gets compiled favoring size, fewer registers, less unrolling because it barely executes. So runtime cost there is irrelevant but its footprint in the binary is not free (it still occupies disk/page-cache space and can evict hot lines from cache if placed carelessly, which is exactly why it gets segregated into .text.unlikely rather than just left unoptimized in place).

Switch/jump-table lowering.
A switch statement with many cases can be compiled as a jump table (fast, O(1), but requires a full table load and indirect jump) or as a cascade of compares (slower per-case but better branch prediction if one case dominates).
Profile data tells the compiler which case actually dominates in practice and picks accordingly.

Given the above,  "reshape the whole binary" is not metaphorical. The compiler is redrawing the physical layout of machine code in the executable: which instructions are adjacent to which, which code sections are hot and packed tightly versus cold and shoved to the side, which calls are direct versus indirect, and where the CPU's fetch/prediction effort gets spent.
None of this requires the values processed during training to resemble production traffic. It only requires the shape of control flow.
Which branches, functions, and paths are frequently exercised to resemble production traffic.
That's the core reason MTR's broad-but-different-data coverage transfers well: it walks nearly every code path in mysqld even though the actual queries and data are nothing like a TPCC workload, and control-flow shape is exactly what PGO optimizes for.


Why my sysbench-trained build loses and how to do it right.

No comments on “PGO or not PGO this is the dilemma. Step 2”

PGO or not PGO this is the dilemma. Step 1

Details
Marco Tusa
MySQL
09 October 2026

Given the topic complexity and the length of this article I have split it in 3 three different blog-post:

  1. What is PGO
  2. How PGO it works
  3. Why my sysbench-trained build loses and how to do it right.

Step 1: What is PGO

PGO (Profile-Guided Optimization) is a two-pass compilation technique. 

First, we build the program with instrumentation that adds counters to every branch, loop, and call site.
Next, we run it against a representative training workload so these counters can record which code paths are actually hot versus cold.
We then recompile the program using that data to drive the compiler's decisions.

With this profiling data, the compiler inlines hot call sites more aggressively and lays out hot paths as straight-line, fall-through code while pushing cold paths out of the way.
Finally, it physically reorders functions in the binary so frequently interacting hot code sits close together for better instruction-cache locality, and converts frequently resolved indirect calls into direct ones.

The result isn't "make the training run fast" but rather "reshape the entire binary's layout around real execution patterns," which is why the quality and representativeness of the training workload matters so much to whether PGO actually helps. 

It is nice to be wrong

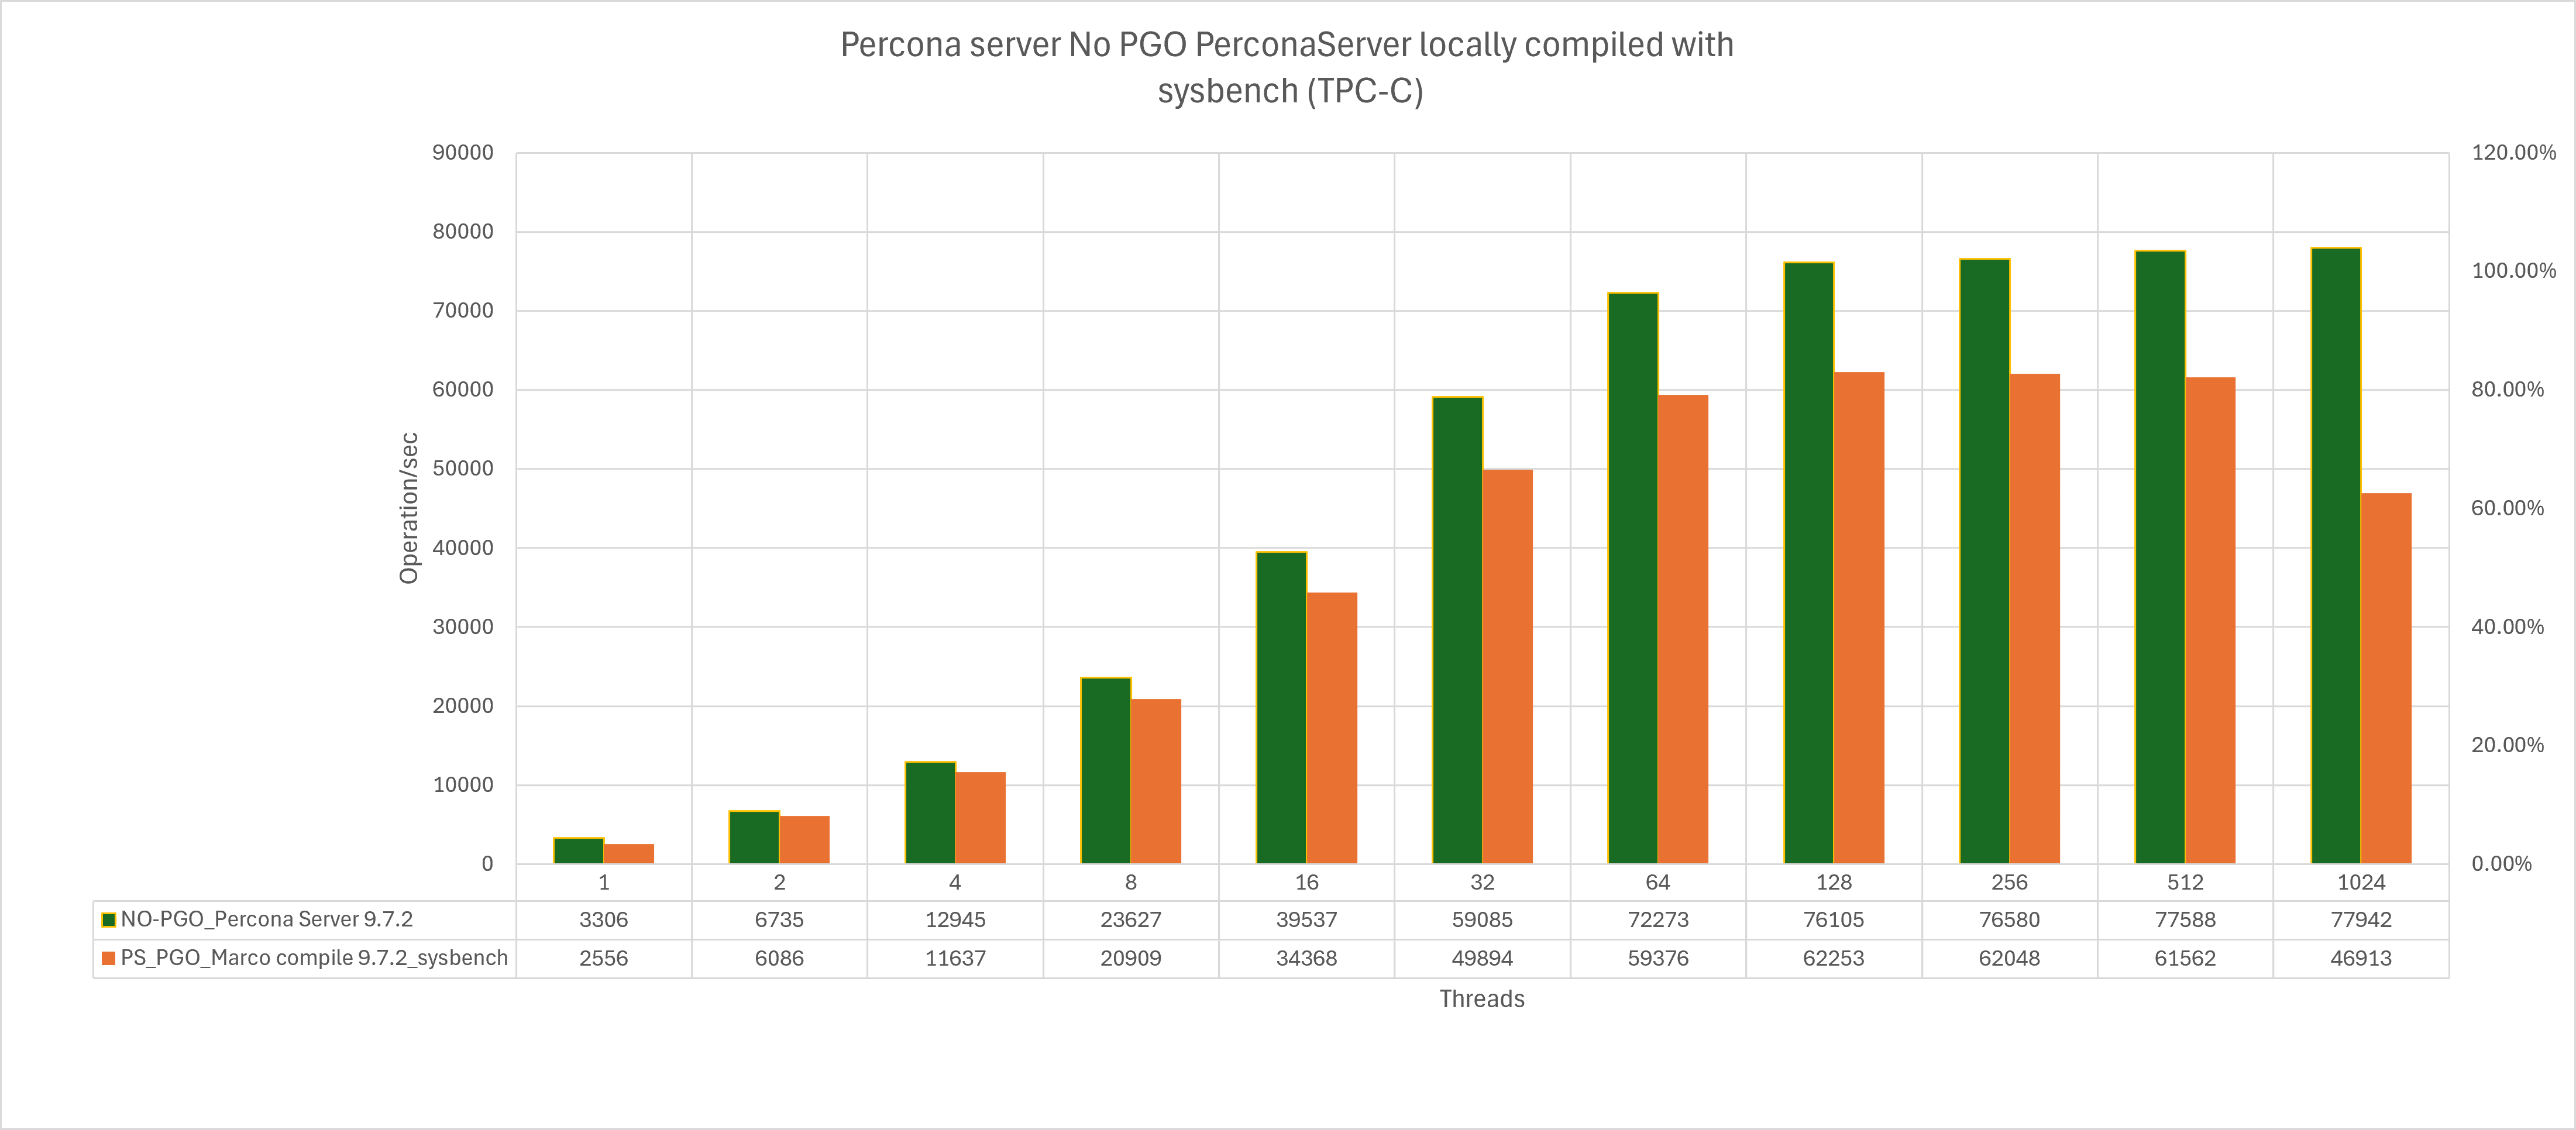
Not so far ago I was wondering if having Percona Server compiled with PGO default is a good idea or not. Then I started to do some tests and I end up with this:

If I compare non PGO with PGO release I can see an optimization, minimal below 5% but is there.

If I compile MySQL using PGO and use as sample the recording of a specific test say sysbench-tpcc my compile will always be slower than my compile without PGO, no mater how many threads I use during recording, I tried from 128 to 1024.

Percona server no pg vs ps marco sysbench pgo


Given my understanding of PGO was that it should be the other way around I was a bit disoriented. So I decided to read a bit and get a better understanding of what PGO really means/does and if it makes sense or not.


How PGO it works

No comments on “PGO or not PGO this is the dilemma. Step 1”

The Galera Crossroads: Why PXC is the Lifeline for MariaDB Community Users

Details
Marco Tusa
MySQL
30 June 2026

Or: Surviving the Codership Acquisition Without Losing Your Cluster

Why this long post?

Recently, the database landscape shifted significantly when MariaDB plc absorbed Codership. If you aren't familiar, Codership is the cgood pxc galera mariasmallompany that introduced the Galera library and the WSREP API to MySQL, creating the first virtually synchronous replication solution for the MySQL ecosystem. For years, they produced their own highly stable, patched version of MySQL + Galera, which was widely adopted alongside solutions like Percona XtraDB Cluster (PXC).

The Post-Acquisition Landscape Following the acquisition, MariaDB plc made a controversial decision: they plan to phase out Galera from the MariaDB Community version and enhance it exclusively for MariaDB Enterprise.

This move sparked a lengthy debate. A large portion of the community pushed back, and even the MariaDB Foundation wasn't aligned with the decision (as detailed in this blog post by lefred).

However, looking at the Foundation's meeting minutes from February 25, 2026, it is clear they ultimately settled on "Option 2." This means the Foundation is willing to keep the existing Galera/WSREP code in the community server, but any future evolution or enhancement of the product will have to rely entirely on external community contributions.

What Does This Mean for You? The reality of the situation is straightforward:

  • Codership is gone.
  • MariaDB plc (the company) will transition the active development of Galera strictly to their Enterprise offering.
  • The MariaDB Foundation will maintain the Galera code "as-is" unless the community actively steps up to provide updates.

As a result, users currently relying on the Codership version of Galera and, in my opinion, those using MariaDB Community may soon find themselves stuck in a difficult position, unsure of what steps to take next.

The Goal of This Document This post is meant to cut through the uncertainty and answer those lingering questions. My goal is to provide you with the facts so you can make an informed decision about your database architecture's future.

Below, you will find a detailed comparison between Percona XtraDB Cluster (based on Galera) and the MariaDB implementation to help you navigate this transition.


1. Executive Summary

Both Percona XtraDB Cluster (PXC) and MariaDB Galera Cluster share a common ancestor: the Galera synchronous multi-master replication library by Codership, PXC does not use the same Galera library as MariaDB. It uses the tracking fork of upstream Galera, and Percona adds many critical fixes that make it actually work in some places (IST stability, gcache, NBO, etc). They both implement the wsrep API and use the same Group Communication System (GCS) for write-set ordering. Despite this shared foundation, they are NOT binary-compatible and you cannot simply swap binaries between them.


The divergence stems from their server cores: PXC is built on Percona Server for MySQL (which closely tracks Oracle MySQL 8.x, 9.x), while MariaDB Galera is built on MariaDB Server, which forked from MySQL around 2010 and has since developed its own independent feature set, system tables, InnoDB patches, GTID implementation, and binary log format.

The gap has widened considerably since MySQL 8.0 introduced a new data dictionary stored entirely in InnoDB (eliminating .frm files), new authentication plugins, and native JSON type changes none of which exist in MariaDB's independent implementation.


2. Why You Cannot Simply Replace the Binaries

This is the most critical section for anyone considering migration. The following incompatibilities make a drop-in binary replacement impossible:


2.1 Data Dictionary and System Tables

MySQL 8.0 as such MySQL with Galera, (and PXC 8.0/8.4) replaced all .frm, .par, .opt, .trn, .trg files with a transactional data dictionary stored in InnoDB. MariaDB never adopted this. MariaDB 10.5 deprecated .frm files but uses its own internal frm-less representation. The system tables (mysql.user, mysql.tables_priv, mysql.columns_priv, mysql.routines, mysql.events, etc.) have fundamentally different schemas. Mounting a PXC data directory with a MariaDB binary will fail at startup and vice versa.


Concrete examples of schema divergence in mysql.user:

  • PXC/MySQL 8.0 uses plugin-centric design; Password column was removed entirely
  • MariaDB retains password column alongside authentication_string
  • PXC defaults to caching_sha2_password; MariaDB defaults to mysql_native_password (10.6 LTS) or ed25519


2.2 GTID Format Incompatibility

GTID implementations are entirely different and mutually incompatible:


Aspect Percona XtraDB Cluster MariaDB Galera Cluster
Format server_uuid:seq_no (e.g. 6b07f8c7-...:1) domain_id:server_id:seq_no (e.g. 0-1-100)
System variable gtid_mode = ON/OFF/ON_PERMISSIVE gtid_strict_mode = ON/OFF
Cluster GTID integration wsrep generates UUID-based GTIDs automatically Requires wsrep_gtid_mode + wsrep_gtid_domain_id
Replication positioning MASTER_AUTO_POSITION=1 MASTER_USE_GTID = slave_pos / current_pos
Cross-product GTID replication Cannot replicate to/from MariaDB using GTID Cannot replicate to/from MySQL 8.x using GTID
Binlog GTID events Gtid_log_event format Gtid_list_log_event incompatible wire format

Any DR topology crossing PXC and MariaDB must use file+position-based replication or purpose-built ETL tools. GTID-based replication between them does not work.


2.3 InnoDB / XtraDB Divergence

  • InnoDB tablespace format: MySQL 8.0 uses a newer undo tablespace design (undo001/undo002) absent in MariaDB
  • Redo log format: MySQL 8.0.30+ uses a new circular redo log; MariaDB uses its own format since 10.5
  • innodb_autoinc_lock_mode: PXC enforces mode=2 via pxc_strict_mode; MariaDB defaults to mode=1 this alone causes certification failures if uncorrected
  • Row format checksums and internal page structures differ between the two InnoDB forks


2.4 Binary Log Format Enforcement

PXC 8.0 hardcodes ROW-based binary logging. Setting binlog_format=STATEMENT or MIXED raises an error regardless of pxc_strict_mode:

ERROR: --binlog-format=STATEMENT is not supported. Use ROW.

MariaDB Galera warns but can run with MIXED format in some scenarios, which risks non-deterministic replication.


2.5 wsrep API and Patch Divergence

Aspect Percona XtraDB Cluster MariaDB Galera Cluster
Galera library Galera 4.x, separate package (libgalera_smm.so) Galera 4.x, embedded in server package since 10.1
wsrep activation Active when wsrep_provider path is configured Requires explicit wsrep_on=ON in my.cnf
Extra status variables 10 PXC-specific wsrep_* variables 1 extra: wsrep_thread_count
Extra config variables pxc_strict_mode, pxc_encrypt_cluster_traffic, pxc_maint_mode, wsrep_reject_queries wsrep_gtid_mode, wsrep_gtid_domain_id, wsrep_patch_version, wsrep_mysql_replication_bundle


2.6 JSON, SQL Modes, and Reserved Words

MySQL 8.0 stores JSON as a native binary type. MariaDB stores JSON as longtext with a CHECK constraint. Tables with JSON columns cannot be physically migrated logical exports (mysqldump) are required and may need schema adjustments. Numerous SQL modes and reserved words differ, causing silent behavioral differences that surface only in application testing.

3. Architecture and Replication Internals

Both products share the same fundamental architecture: a database server patched with the wsrep API communicates with the Galera plugin (libgalera_smm.so), which handles Group Communication via the Totem Single Ring Ordering protocol and write-set certification.


3.1 Write-Set Replication Flow

The flow is identical because it is implemented in the shared Galera library:

  • Transaction executes locally; InnoDB registers each modified row key via wsrep append_key()
  • On COMMIT: wsrep packages row keys + binary log event as a write-set (WS)
  • WS is sent to GCS, which assigns a global sequence number (seqno) and broadcasts to all nodes
  • Every node independently certifies the WS against its local Certification Conflict Vector (cert_index_ng)
  • Conflict (same row key at overlapping seqno range): certification fails → ERROR 1213 Deadlock
  • Pass: WS applied via applier thread; certification is deterministic every node reaches the same decision


Galera uses optimistic locking at the cluster level, pessimistic locking locally.

A transaction acquires row locks on the originating node (standard InnoDB pessimistic locking) but has no visibility into locks on other nodes. Conflicts are detected only at commit time.


3.2 Brute Force Abort

When an incoming replicated write-set conflicts with a local uncommitted transaction, the incoming write-set always wins. The local transaction is rolled back immediately and the client receives ERROR 1213. Applications must implement retry logic this is not optional for multi-writer topologies. Both products behave identically here; the difference is in monitoring granularity (PXC exposes wsrep_local_bf_aborts and wsrep_local_cert_failures).


4. Flow Control

Flow Control (FC) is the back-pressure mechanism that prevents fast writers from overwhelming slow appliers. When a node's receive queue exceeds gcs.fc_limit, it broadcasts a FLOW_CONTROL_PAUSE message to the entire cluster. All nodes suspend committing until the queue drains below gcs.fc_factor × gcs.fc_limit.


  • FC is cluster-global: when ONE node pauses, ALL nodes stop committing
  • Creates latency spikes visible to all applications on all nodes
  • The pausing node continues applying its backlog during FC
  • Frequent FC indicates the cluster is write-bound beyond what the slowest node can absorb


4.1 Observability PXC vs MariaDB

Aspect Percona XtraDB Cluster MariaDB Galera Cluster
wsrep_flow_control_paused Available fraction of time in FC Available in both Enterprise and community
wsrep_flow_control_sent/recv Available Available in both Enterprise and community
wsrep_flow_control_status PXC ONLY ON or OFF right now Not available
wsrep_flow_control_interval PXC ONLY current [low, high] range Not available
wsrep_flow_control_interval_low/high PXC ONLY individual thresholds Not available
wsrep_cert_bucket_count PXC ONLY cert index hash buckets Not available
wsrep_gcache_pool_size PXC ONLY gcache memory in use Not available
wsrep_ist_receive_seqno_* PXC ONLY IST progress (start/current/end) Not available


4.2 Key FC Tuning Variables (both products)

wsrep_provider_options key Default Effect
gcs.fc_limit 100 Recv queue depth that triggers FC pause. Raise for bursty writers.
gcs.fc_factor 1.0 Queue must drop below fc_limit × fc_factor to resume. Lower = resumes sooner.
gcs.fc_master_slave no Set yes for single-writer topology to disable FC on the writer node.
gcs.max_packet_size 64500 Max GCS packet size. Set larger than your largest expected write-set.


5. Streaming Replication and Large Transaction Handling

Streaming Replication (SR) is a Galera 4 feature available in both PXC 8.0+ and MariaDB 10.4+. It splits large transactions into fragments that are replicated and certified before the final COMMIT.


Without SR: A 1M-row UPDATE runs entirely on one node. At commit, the entire write-set is sent. Other nodes stall 28–30 seconds certifying and applying it. All unrelated writes cluster-wide are blocked during this window.


With SR (wsrep_trx_fragment_size > 0): Fragments are replicated mid-transaction. Each certified fragment acquires row locks on ALL nodes, providing cluster-wide row-level locking during the transaction. Conflicting transactions on other nodes WAIT rather than certifying and failing later.


The trade-off: Galera double-writes fragments to mysql.wsrep_streaming_log (an InnoDB table). A 34-second update without SR takes 40 seconds with 1MB fragments, and 51 seconds with 0.1MB fragments. Fragment rollback propagates to all nodes more expensive than a local-only rollback.


Variable Values Notes
wsrep_trx_fragment_size 0 (off), N Fragment size in units of wsrep_trx_fragment_unit
wsrep_trx_fragment_unit bytes, rows, statements Recommend bytes; 1MB is a reasonable starting point for most workloads
Session-scope only Yes Do not enable globally. Enable per-session for known large transactions only.


No difference between PXC and MariaDB on SR it is identical Galera 4 library behavior in both.


6. Split Brain, Quorum, and Primary Component

Split-brain protection is implemented identically in both products via the Galera GCS layer.

6.1 Primary Component Election

When a network partition occurs, each segment runs a membership algorithm. The segment with strictly more than 50% of cluster weight becomes the Primary Component (PC). Minority segments enter non-primary state:

  • All writes rejected: ERROR 1047 WSREP has not yet prepared node for application use
  • Reads permitted (effectively read-only)
  • Node waits until network heals and PC is re-established


6.2 Garbd Arbitrator

For 2-node or even-node clusters, garbd is a lightweight voting member without data storage. Both products ship it. Mixing garbd binaries from PXC and MariaDB in the same cluster is not recommended due to potential wsrep API version differences.


6.3 Node Weighting (pc.weight)

Both products support pc.weight in wsrep_provider_options to assign higher votes to specific nodes. Use this to prioritize primary datacenter nodes over DR nodes in quorum calculations preventing the DR site from forming a spurious PC if the link to the primary drops.


6.4 Split-Brain Recovery

  • Identify the most advanced node: inspect grastate.dat and the seqno field
  • The node with safe_to_bootstrap: 1 was the last to write cleanly
  • Bootstrap from it: SET GLOBAL wsrep_provider_options="pc.bootstrap=YES"; or restart with --wsrep-new-cluster
  • Re-provision all other nodes via SST from the bootstrapped node (losing diverged writes)
  • Verify with pt-table-checksum after cluster reform


PXC-specific advantage: pxc_maint_mode. Provides DISABLED / PXCMAINT / MAINTENANCE states. PXCMAINT signals load balancers to drain the node gracefully before maintenance. MariaDB has no equivalent HAProxy/ProxySQL coordination that must be done externally.


7. State Transfer: SST and IST

7.1 IST (Incremental State Transfer)

Used when a node rejoins after a short absence and the donor's gcache still contains the missing write-sets. Fast and non-blocking to donor. Mechanism is identical in both. PXC adds monitoring:

  • wsrep_ist_receive_status: text description of IST state
  • wsrep_ist_receive_seqno_start / current / end: enables building a completion percentage

MariaDB provides none of these; IST progress requires log file grepping.


7.2 SST (Full State Transfer)

Aspect Percona XtraDB Cluster MariaDB Galera Cluster Impact
Default method xtrabackup-v2 mariabackup (recommended) Both are production-grade
CLONE SST YES native MySQL CLONE plugin; no external binary; encrypted by default NO not available in MariaDB PXC can provision a new node with zero external tooling; MariaDB always requires mariabackup binary installed and configured on all nodes
Backup tool Percona XtraBackup (xtrabackup) MariaDB Backup (mariabackup, fork of xtrabackup 2.3) The tools are incompatible. PXC's backup files cannot be restored by mariabackup and vice versa. Migration between the two products requires a full logical dump, not a physical copy
Cross-product SST xtrabackup CANNOT restore MariaDB data mariabackup CANNOT restore PXC data Hard blocker for any hybrid topology or live migration attempt using physical SST. Reinforces that the two clusters cannot share nodes
Donor blocking CLONE: non-blocking to read. xtrabackup:  --lock-ddl=REDUCED even DDLs don't block the donor mariabackup: brief FTWRL, then non-blocking Operationally equivalent for xtrabackup vs mariabackup paths. CLONE and new option in PXC eliminates even the brief lock, making it preferable for write-sensitive donors
wsrep_allowlist PXC 8.0+ IP allowlist for SST/IST requests Not available in MariaDB Galera Without an allowlist, any node that knows the cluster address can request an SST, increasing the attack surface. PXC allows hardening this at the database layer; MariaDB relies entirely on network-level controls
Encryption pxc_encrypt_cluster_traffic covers SST automatically Requires separate SSL config per SST method In MariaDB, SST encryption is configured independently from replication traffic encryption. A misconfiguration (e.g. TLS enabled for write-sets but forgotten for SST) silently transfers a full data snapshot in plaintext — a common security gap. PXC's single-variable approach eliminates this risk by default


8. DDL Handling and Online Schema Changes

Schema changes are the most operationally dangerous operations in Galera. Both products support three mechanisms via wsrep_OSU_method.

8.1 TOI Total Order Isolation (default)

DDL is executed across all nodes in global total order. Every node pauses at the same logical point, applies the DDL, then resumes. Safe but causes cluster-wide stall for the DDL duration. For large tables this means minutes of downtime. Identical behavior in both products.

8.2 RSU Rolling Schema Upgrade

Desynchronizes one node (wsrep_desync=ON), applies DDL locally, then re-syncs. Cluster continues processing during upgrade on that node. Risk: schema is temporarily inconsistent across nodes. Identical behavior in both products.

8.3 NBO Non-Blocking Operation (KEY DIFFERENCE)

NBO acquires a metadata lock only at the very start and very end of the DDL. The DDL executes independently on each node while the cluster processes other statements normally.


  • PXC 8.0.25+ (Community / Open Source): NBO is fully supported for CREATE/ALTER/DROP INDEX and ALTER TABLE index operations. Available at no cost in the standard community release.
  • MariaDB Galera (Enterprise Only): NBO is restricted to MariaDB Enterprise Server. The community edition does NOT support NBO only TOI and RSU are available. This is a significant operational disadvantage for large table DDL in production.


External tools for Galera-safe DDL:

  • pt-online-schema-change: works with Galera, requires pxc_strict_mode=PERMISSIVE during execution (PXC), careful configuration


9. Disaster Recovery Architectures

Galera provides a synchronous multi-master within a cluster. For DR across geographic sites, both products rely on asynchronous MySQL replication. The GTID incompatibility is the main constraint.


9.1 Async Replica as DR Node

Standard DR pattern: async replica in DR site replicates from one Galera node. Requirements for both products:

  • log_slave_updates = ON on all cluster nodes (cluster writes must reach binlog for async replicas)
  • binlog_format = ROW (enforced by PXC; must be set explicitly in MariaDB)


Critical: DR replica must be the same product family. A PXC cluster cannot replicate to a MariaDB DR node via GTID (format mismatch). File+position replication is possible but loses GTID safety. In practice: PXC → Percona Server/PXC DR; MariaDB → MariaDB Server DR.


9.2 Geo-Distributed Galera

Galera can technically span datacenters, but WAN latency adds directly to commit latency (certification is synchronous). At 20ms RTT, every write adds 20ms to commit time. Both products are equally affected. Mitigation: tune evs.* provider options for WAN tolerance. However for most kinds of workloads, async replication between sites is a must to geo-distributed Galera.


9.3 PMM Integration

PXC integrates natively with Percona Monitoring and Management (PMM), providing built-in Galera dashboards, flow control visualization, write-set lag tracking, and cluster state alerting. MariaDB Galera can be monitored by PMM but requires additional dashboard configuration and custom exporters for full visibility.


10. PXC-Specific Features

10.1 pxc_strict_mode

Performs safety validations at startup and runtime. Modes: ENFORCING (default), PERMISSIVE, DISABLED.

ENFORCING blocks:

  • MyISAM DML (would not replicate, causing silent data divergence)
  • Tables without primary keys (certification is key-based; no PK causes full-table locks in certification)
  • Non-ROW binlog_format
  • log_output=FILE (can impact applier performance)
  • innodb_autoinc_lock_mode != 2 (mode 1 can cause gaps/deadlocks in multi-master)


MariaDB has no equivalent. Without this enforcement, operators can accidentally run MyISAM writes or INSERT into a table without a PK on a MariaDB node and the operation silently succeeds locally but is not replicated, causing cluster data divergence.


10.2 pxc_encrypt_cluster_traffic

A single variable (ON by default in PXC 8.0) that enables TLS for ALL cluster traffic: write-set replication, SST, IST, and internal service messages. In MariaDB Galera, each of these requires separate SSL configuration. Misconfiguration can leave SST traffic unencrypted while write-set traffic is encrypted a common security gap in MariaDB Galera deployments.


10.3 CLONE SST Plugin

PXC's CLONE SST (default since 8.0.41) requires no external backup tool, uses MySQL's native encryption, and is non-blocking for reads on the donor. Node provisioning is simpler, faster for smaller datasets, and requires no xtrabackup binary installation.


10.4 GCache and Write-Set Cache Encryption

Introduced in PXC 8.0.31-23. Currently a tech preview feature.

What it does: Encrypts two on-disk structures that Galera uses to buffer replication data:

GCache (RingBuffer file) the persistent on-disk write-set cache used for IST. Encryption uses a two-layer key scheme: the Keyring stores only a Master Key, which encrypts a per-file File Key. The encrypted File Key is stored in the RingBuffer's preamble. Since the RingBuffer is non-volatile (survives restarts), the File Key must be retrievable from the preamble on restart.

Write-Set cache (allocator disk pages) temporary disk pages spilled during large transactions. These are ephemeral (not persistent across restarts), so no File Key is stored encryption is in-memory-keyed only.

How to enable via wsrep_provider_options:

Variable Default Controls
gcache.encryption off Enable/disable GCache encryption
gcache.encryption_cache_size 16MB Encryption cache size (max 512 pages)
gcache.encryption_cache_page_size 32KB Must be a multiple of CPU page size (typically 4KB)
allocator.disk_pages_encryption off Enable/disable Write-Set cache encryption
allocator.encryption_cache_size 16MB Same structure as GCache
allocator.encryption_cache_page_size 32KB Same constraint

Master Key rotation:

sql

ALTER INSTANCE ROTATE GCACHE MASTER KEY;

Requires a keyring plugin or keyring component (e.g. keyring_file, keyring_vault) loaded and configured. The keyring file should be stored outside the data directory.

GCache and Write-Set Cache Encryption


10.5 FC Auto Eviction of Lagging Nodes

Introduced in PXC 8.0.33-25 (PXC-3760).

The problem it solves: When a node is persistently slow, it drives Flow Control (FC) for the entire cluster, throttling all writes. Previously, operators had to manually evict such a node. This feature makes the node evict itself when it has been in FC too long.

How it works: A sliding time window tracks FC activity. If FC time within that window exceeds a threshold ratio, the node self-leaves the cluster.

Variables (set via wsrep_provider_options, both static require restart):

Variable Default Description
gcs.fc_auto_evict_window 0 (disabled) Width of the observation window (seconds). 0 = feature off.
gcs.fc_auto_evict_threshold 0.75 Ratio (0.0–1.0): if FC time ÷ window ≥ this value, node self-evicts.

Example: With gcs.fc_auto_evict_window=60 and gcs.fc_auto_evict_threshold=0.75, if a node spends ≥ 45 seconds of any 60-second window in FC, it leaves the cluster automatically.

There is also the older, separate EVS-level auto eviction:

Variable Default Description
evs.auto_evict 0 (disabled) Number of delayed-list entries allowed before EVS auto-evicts a slow node. Requires evs.version=1.
evs.evict   Manual eviction: set to a node's UUID to force evict it.
evs.delay_margin PT1S How long a node can lag before being added to the delayed list.

wsrep_provider options index


11. MariaDB Galera-Specific Features

11.1 wsrep_gtid_mode and wsrep_gtid_domain_id

MariaDB's GTID integration with Galera is more explicit. wsrep_gtid_mode=ON ensures all Galera write-sets carry consistent MariaDB GTIDs using the domain from wsrep_gtid_domain_id. Critical for async replication topologies where downstream replicas need GTID-based position tracking. PXC handles this automatically via MySQL's native GTID integration in the wsrep patch.


11.2 WSREP_INFO Plugin

MariaDB contributed the WSREP_INFO plugin, which exposes cluster membership as queryable information_schema tables:

SELECT * FROM information_schema.WSREP_MEMBERSHIP;

SELECT * FROM information_schema.WSREP_STATUS;

More ergonomic than parsing SHOW STATUS LIKE 'wsrep%'. PXC achieves equivalent visibility through status variables and PMM but does not have these information_schema tables natively.


11.3 Embedded Galera and Simplified Installation

Since MariaDB 10.1, Galera support is embedded in the server package (no separate galera lib install). Activated by wsrep_on=ON. PXC ships libgalera_smm.so as a separate package alongside the server package. Operationally minor, but reduces packaging complexity in some deployment automation scenarios.


11.4 MariaDB-Unique Database Features

MariaDB Galera supports several features PXC/MySQL 8.x does not have:

  • System-Versioned Tables (temporal tables, SQL:2011 standard) work with Galera replication
  • Sequence objects (CREATE SEQUENCE)
  • Spider storage engine for horizontal sharding
  • COMPRESS() / UNCOMPRESS() improvements
  • Different JSON implementation (LONGTEXT + CHECK) more portable but less performant for JSON operations


12. Performance Characteristics

12.1 Write Throughput and Concurrency Scaling

Both impose identical write amplification: every write executes on every node. Server-level performance differences:


  • High concurrency (>128 threads): PXC 8.4 (MySQL 8.4 base) scales better. In Percona's 2026 ecosystem benchmark, MySQL 8.4 and Percona Server 8.4 reached 13,325–13,385 TPS at 512 threads. MariaDB variants peak at 128 threads then show notable degradation.
  • Low concurrency / single-thread: MariaDB performs better. MariaDB 10.11 shows excellent single-thread throughput.
  • Galera overhead: Write-set certification adds ~2–5% overhead on commit versus standalone MySQL. Identical for both products.


12.2 IST Performance

Percona has demonstrated up to 4x IST improvement in PXC through parallelized write-set application during IST. MariaDB has also improved IST threading but has fewer published benchmarks for direct comparison.


12.3 Large Transaction Performance

Without Streaming Replication, both products behave identically: full write-set certification blocks other nodes during apply. With SR enabled, both achieve similar improvements via Galera 4 library behavior. No meaningful advantage for either product.


13. Key Configuration Differences Summary


Parameter PXC 8.x MariaDB Galera 10.x/11.x
wsrep activation Active when wsrep_provider path set wsrep_on=ON required explicitly
binlog_format ROW enforced cannot change ROW recommended; MIXED possible with caveats
innodb_autoinc_lock_mode Must be 2 (pxc_strict_mode enforces) Defaults to 1 must manually set to 2
SST default method xtrabackup-v2 mariabackup
Cluster traffic encryption pxc_encrypt_cluster_traffic=ON (default) Manual SSL config per subsystem
Safety enforcement pxc_strict_mode=ENFORCING (default) No equivalent manual discipline required
Maintenance drain pxc_maint_mode=PXCMAINT/MAINTENANCE Must coordinate externally with load balancer
Online DDL (NBO) Index ops supported open source Enterprise Server only (not community edition)
GTID integration MySQL GTID native; automatic wsrep_gtid_mode + wsrep_gtid_domain_id needed
IST progress monitoring wsrep_ist_receive_seqno_* variables Log file parsing only
Monitoring PMM native + 10 extra wsrep_* status vars WSREP_INFO plugin; PMM needs extra setup
Flow control visibility wsrep_flow_control_status/interval/interval_low/high Only basic paused/sent/recv counters
IP allowlist for SST/IST wsrep_allowlist (8.0+) Not available
GCache + Write-Set cache encryption gcache.encryption and allocator.disk_pages_encryption via wsrep_provider_options; Master Key via ALTER INSTANCE ROTATE GCACHE MASTER KEY; keyring plugin/component required (since 8.0.31-23, tech preview) Not available
FC auto eviction of lagging node Node self-evicts when FC time exceeds gcs.fc_auto_evict_threshold ratio within gcs.fc_auto_evict_window; older EVS-level evs.auto_evict also available (since 8.0.33-25) Not available


14. Decision Guidance

Choose PXC when:

  • If you use MySQL Galera and require the shortest possible path to replace it
  • Application requires MySQL 8.x-specific features (native JSON binary type, improved window functions, roles, invisible columns)
  • You need enforced cluster safety pxc_strict_mode catches dangerous configurations before they diverge data
  • Simplest possible encryption setup is required (pxc_encrypt_cluster_traffic=ON)
  • Using PMM for monitoring and want native Galera dashboards out of the box
  • You need NBO (online DDL for indexes) without an enterprise license
  • Already using Percona XtraBackup for backups SST toolchain is shared
  • DR replication topology connects to MySQL 8.x replicas (GTID-compatible)
  • High concurrency (>128 threads) write workloads where MySQL 8.x scales better


Choose MariaDB Galera when:

  • Application relies on MariaDB-specific features: temporal tables, Sequences, Spider, Aria, MariaDB stored procedure syntax differences
  • Async replication to MariaDB-native replicas using GTID is required
  • Team DBA expertise is MariaDB-centric
  • Low-concurrency workloads where MariaDB single-thread performance is superior
  • WSREP_INFO plugin’s information_schema tables are useful to your monitoring tooling


Migrating between the two:

  • Full logical migration only, no physical data directory copy is possible
  • Use mysqldump or mydumper; expect schema adjustments for JSON columns, auth plugins, and reserved words
  • Reconfigure entire GTID replication topology
  • Allow significant application testing time SQL mode, optimizer, and implicit conversion differences will surface
  • Test pxc_strict_mode=ENFORCING carefully existing MariaDB schemas often have tables without PKs or MyISAM tables that will block startup



No comments on “The Galera Crossroads: Why PXC is the Lifeline for MariaDB Community Users”

Stop Guessing Your Kubernetes MySQL Configs: Meet the MySQL Operator Calculator

Details
Marco Tusa
MySQL
13 June 2026

Let’s be honest: migrating a relational database to Kubernetes sounds fantastic in a whiteboard meeting, but the reality of day-two operations is a completely different story.

When moving MySQL to Kubernetes, the ultimate goal is simple: identify a safe, performant set of configuration values for your database pods. But where do you start? Usually, you look at your overall node resources say, a machine with 16 CPUs and 64GB of RAM.front image calculator

In the old bare-metal days, you'd apply the standard rules of thumb:

  • Set innodb_buffer_pool_size to 60-80% of total RAM to maximize caching.

  • Allocate 1 innodb_buffer_pool_instances per 1GB of buffer pool.

  • Match innodb_io_capacity to your drive speeds.

If you try applying these legacy rules in Kubernetes, your pod won't survive.

The Kubernetes Reality Check: OOMKills and Probe Traps

Why do the old rules fail? Because Kubernetes environments lack swap space. If a pod exceeds its assigned memory limit, Kubernetes executes an immediate, destructive action: an OOMKill.

Standard tuning rules don't account for the hidden memory consumers inside a K8s pod. You aren't just allocating memory for MySQL anymore; you have to share the pod's limits across running connections, the routing proxy, monitoring sidecars, and internal database processes.

For example, extensive testing reveals that Percona Server (PS) with Group Replication consumes about 9% to 11% more memory than Percona XtraDB Cluster (PXC) under the exact same load. If you blindly allocate 80% of your RAM to the buffer pool, that extra 10% overhead from Group Replication will push you right over the edge.

Memory isn't the only trap. During OLTP load testing (using sysbench TPC-C), pods can get killed before memory even peaks. The culprit? Kubernetes liveness and readiness probes. Under heavy load, a perfectly healthy database pod might take slightly longer to respond. If your probe timeouts are too short, K8s assumes the pod is dead and kills it with no questions asked.

Step 1: Discover Your Actual Resources

To avoid these pitfalls, you must know what resources you actually have before tuning anything. A 64GB node does not give you 64GB of pod memory. Cloud providers run system pods to manage the cluster, which silently consume your baseline resources.

Before applying any configurations, check your node:

Bash
kubectl describe node <nodename>

You might see something like this in the output:

Plaintext
  Resource           Requests    Limits
  --------           --------    ------
  cpu                702m (4%)   1200m (7%)
  memory             645Mi (1%)  1994Mi (3%)

In this scenario, 7% of the CPU and 3% of the memory are already spoken for. Your 16 CPUs and 64GB of RAM are actually closer to 14 CPUs and 58GB of usable memory. If you base your manual database tuning on the 64GB fantasy, you are already on a collision course with an OOMKill.

You could try to manually scale down your buffers to be "safe" (e.g., arbitrarily dropping the buffer pool to 50%), but then you sacrifice massive amounts of performance.

This is where the guessing game has to stop.

Enter the MySQL Operator Calculator

Built as a lightning-fast, RESTful Go service, the MySQL Operator Calculator is designed to take this exact math entirely out of your hands.

Instead of manually calculating overheads for proxies, monitors, and Group Replication, you simply feed the calculator your actual available pod resources and workload type. It dynamically computes the optimal, mathematically safe configuration parameters for your Kubernetes operator (such as the Percona Operator for MySQL).

Why You Need It in Your Toolkit:

  • Say Goodbye to OOM Kills: The tool mathematically balances your total allocated memory across the three critical components of a modern K8s database pod: the mysql engine, the proxy layer, and the monitor agent.

  • Workload-Aware Tuning: Simply tell the calculator your load type (Read-Heavy, Light OLTP, or Heavy OLTP), and it adjusts the buffers and threads accordingly.

  • Automation: Designed with modern infrastructure in mind, the calculator outputs clean, structured json. You can easily curl the API from your CI/CD pipelines to automatically inject calculated configurations into your Helm charts.

  • Auto-Calculated Connections: Not sure how many connections your memory limit can safely handle? Pass 0 for connections, and the tool will calculate the maximum safe threshold for you.

How It Works in Practice

Getting your optimized configuration is as simple as making an HTTP request. Let's say you have a heavy OLTP Percona XtraDB Cluster (PXC), you've identified you have exactly 4 CPUs and 2.5GB of RAM available, and you want the tool to figure out the max connections for MySQL 8.0.33. Just ask:

Bash
curl -i -X GET -H "Content-Type: application/json" -d '{
  "output": "human",
  "dbtype": "pxc",
  "dimension": {
    "id": 999,
    "cpu": 4000,
    "memory": "2.5G"
  },
  "loadtype": {"id": 3},
  "connections": 0,
  "mysqlversion": {"major": 8, "minor": 0, "patch": 33}
}' http://127.0.0.1:8080/calculator

Using the human output flag gives you a highly readable, my.cnf-style output, while the json flag provides structured data detailing the exact configuration section, calculated value, and the safe minimums/maximums used in the background math.

Ready to Stop Guessing?

Container orchestration is complex enough without having to manually calculate memory overheads on a calculator app at 2:00 AM during an outage. By programmatically determining your limits, you ensure your database remains stable, performant, and perfectly sized for its environment.

This is why I developed this tool, initially for my personal use, but I think it can be useful to others, so here we go:

Check out the source code, compile the binary, and start optimizing your clusters today by visiting the MySQL Operator Calculator on GitHub.

Or you can try it using the service at tusacentral.net:8080 like:

curl -i -X GET -H "Content-Type: application/json" -d '{
"output":"human",
"dbtype":"group_replication", 
"dimension": {"id": 999, "cpu": 16000, "memory": "64G"}, 
"loadtype": {"id": 3}, 
"connections":1500,
"mysqlversion":{"major":8,"minor":4,"patch":8},
"providercostpct":0.10}' http://tusacentral.net:8080/calculator

This is just for demo and cannot be used as reference for a service, please build your own server for that.


Of course the use of the settings generated is at your own risk, I am not taking any responsability in case they are not working, so test them over and over and see if they match your needs.

Also read the recent blogs https://tusacentral.net/joomla/index.php/mysql-blogs/265-group-replication-vs-percona-xtradb-cluster-the-true-cost-of-consistency and https://tusacentral.net/joomla/index.php/mysql-blogs/266-the-failover-brownout-rethinking-high-availability-in-mysql-group-replication
they are VERY important to understand what is going on in the operator especially the one using Grup Replication.

PR or issue requests are welcome.

No comments on “Stop Guessing Your Kubernetes MySQL Configs: Meet the MySQL Operator Calculator”

More Articles …

  1. The Failover Brownout: Rethinking High Availability in MySQL Group Replication
  2. Group Replication VS Percona XtraDB Cluster: The True Cost of Consistency
  3. MySQL Belgian Days and FOSDEM 2026: My Impressions
  4. joins... joins... everywhere
  5. The 10 TB Scale Survival Guide for Percona Operator PXC on Kubernetes
  6. MySQL January 2026 Performance review
  7. How to Set Up the Development Environment for MySQL Shell Plugins for Python
  8. MySQL latest performance review
  9. How to migrate a production database to Percona Everest (MySQL) using Clone
  10. Sakila, Where Are You Going?
Page 1 of 26
  • Start
  • Prev
  • 1
  • 2
  • 3
  • 4
  • 5
  • 6
  • 7
  • 8
  • 9
  • 10
  • Next
  • End

Related Articles

  • The Jerry Maguire effect combines with John Lennon “Imagine”…
  • The horizon line
  • La storia dei figli del mare
  • A dream on MySQL parallel replication
  • Binary log and Transaction cache in MySQL 5.1 & 5.5
  • How to recover for deleted binlogs
  • How to Reset root password in MySQL
  • How and why tmp_table_size and max_heap_table_size are bounded.
  • How to insert information on Access denied on the MySQL error log
  • How to set up the MySQL Replication

Path

  1. Home
  2. MySQL Blogs
  3. How to stop an offending query with ProxySQL

Latest conferences

We have 26131 guests and one member online

login

Remember Me
  • Forgot your username?
  • Forgot your password?
Bootstrap is a front-end framework of Twitter, Inc. Code licensed under MIT License. Font Awesome font licensed under SIL OFL 1.1.